January 23, 2017
Data and Intuition: How Architects Use Analytics to Make Hospitals Better
Data Visualization Helps Architects Make Better Hospitals.
Sutter Health’s Palo Alto Medical Foundation, San Carlos, CA. An enclosed walkway connects the main lobby and clinical lobbies. A custom-cut, canopy provides an ever-changing pattern of dappled light throughout the day, evoking a walk through nature.
All images courtesy NBBJ
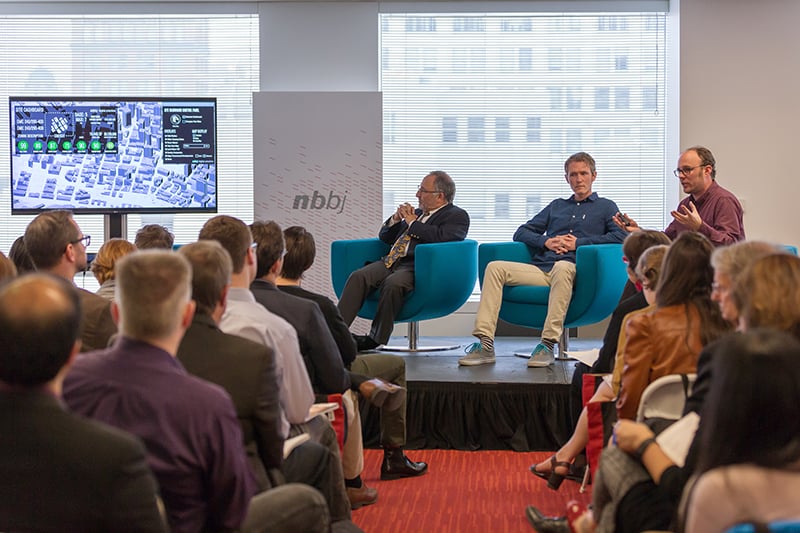
In this installment of the Metropolis Think Tank series, Susan S. Szenasy talks to a panel of professionals from the design, healthcare, and technology fields who are using data to understand their clients’ needs. The discussion took place on February 25, 2016 in San Francisco with members from design firm NBBJ and data visualization studio Stamen Design. Panelists discuss the problems implicit in big data and its visualization as well as human intuition. What follows is an edited transcript of the conversation.
Susan S. Szenasy, publisher and editor in chief, Metropolis (SSS): While digital technology has become a supportive tool to decision making, we have a responsibility, when dealing with big data, to make sure that the knowledge we are receiving is not without intuition. How do humans come into this new equation?
Eric Socolofsky, design technologist, Stamen Design (ES): It’s human intuition to want to make sense of data. Much of our practice is centered on helping our clients discover narratives inherent in their data by using graphic and interaction design to visualize and map different concepts and scenarios.
Michael Kaiser, M.D., former healthcare strategy director, NBBJ (MK): Visualization is key. At firms like NBBJ, a large group of technologists, designers, and experts in different disciplines work together to communicate research data to clients. What we’re finding is that there’s a great advantage in demonstrating these results rather than just iterating the information. Visualization makes the difference between receiving data and understanding the impact of what the numbers mean. Not only does it help the communication, but it also lends credibility to the results.
Marc Syp, creative technologist and design computation Leader, NBBJ (MS): In a lot of our computation work, we’re generating our own data. Ultimately, our clients are making decisions based on our data, so we have a responsibility to present it back to them in an intelligible way. The big questions for the future are: How will we store and manage big data sets? What are we trying to learn from them?
MK: It’s essential that we ask questions of our data. When I served as chief executive and chief medical officer of Louisiana State University’s Health Care Services Division, I asked over and over about the redundancy of our data system and what would happen in the event of a flood. When Hurricane Katrina hit, there was one switch in the basement that got flooded, and it took down the whole system. I think we’re learning that it’s important for every part of government to think through what the impact would be if any system went down. Data is prevalent not just in hospitals, but in schools, local government, and police headquarters as well.

Panelists discuss how graphic data interfaces affect urban scale planning decisions.
THE CHALLENGES OF DATA REDUNDANCIES
SSS: I have been wondering why, in architecture, redundancy isn’t taken as seriously as it needs to be, especially now that natural threats are looming around us. Is this purely a cost issue?
MS: One of the challenges our industry faces is to understand where the data overlaps. We have to design a way to funnel data properly so that we normalize it. If we don’t plan for this, we need to seek out services that do.
MK: Part of the data redundancy issue lies in ignorance. Some of it is expense. I don’t think we’ve fully understood what resiliency and redundancy really meant until we lived through enough of these climate events in the 21st century.
MS: While these events have been distributed, we now have the data to reenact their stories. For architects, that means we can use data to build better buildings based on the failures of the past. In regards to the experience in Louisiana, what’s the case that you make for visualizing and communicating information in a different medium?
ES: I wasn’t in Louisiana during Hurricane Katrina, but I think that if you collect that data and visualize it, then you can correlate the impact of these national systems on buildings from a data visualization perspective as opposed to an anecdotal perspective. I’d like to add that using data in this way is not necessarily about figuring out when something is going to happen or if it’s going to happen. You may have a superstorm that does very little, or you may have a small storm that happens to coincide with the full moon, and then you are in for a big tidal surge. I think one of the powers of visualization is to add nuance to the conversation.
SSS: Let’s talk a little about energy use in hospitals. How do you use data to address its overuse? And how do your decisions affect hospital design?
MS: We’re looking at those issues in hospital renovations as well as new buildings. One of the things that a lot of our tools have in common, in terms of generating analyses and data about our designs, is that they’re trying to push all those issues much further upstream in the conceptual design process. Visualization is super important. A client always has competing interests in terms of what they’re trying to solve. If we can get all of those things on the table at the beginning, they’re much more likely to be respected or to impact the decision making.
MK: From a client perspective, some of the problem lies in the failed model of having operating costs in one bucket and renovation costs in another. The more a firm like NBBJ can tie those two buckets together in a presentation, the more understanding the client might have that it’s necessary to pay more up-front in order to get the long-term operational savings, whether that be in energy or other factors.
SSS: There’s a third bucket that we don’t often talk about, and that’s staffing. This obsession with Return-on-Investment can be damaging to great humanistic design. How do you measure ROI while making sure the nurses are happy, healthy, and taking care of their patients?
ES: For what it’s worth, I think that architects and designers in general are in a unique position to be able to convince their clients that every answer isn’t in the data. There’s a reason why we have design training, and that is to apply our knowledge and past experiences to help guide decisions down paths that may be tangential or parallel to what the data is suggesting, but we know that there’s a greater responsibility to not just adhere to what the data is telling us to do.
MS: When designers don’t complement data sets with their excellent intuition, they latch onto the data part and think that everything has to be a data-driven decision. The fact is that you’re never going to be able to quantify every point in your design equation. If you try to, you lose the ability to make the kinds of decisions that would probably be of great benefit to you.
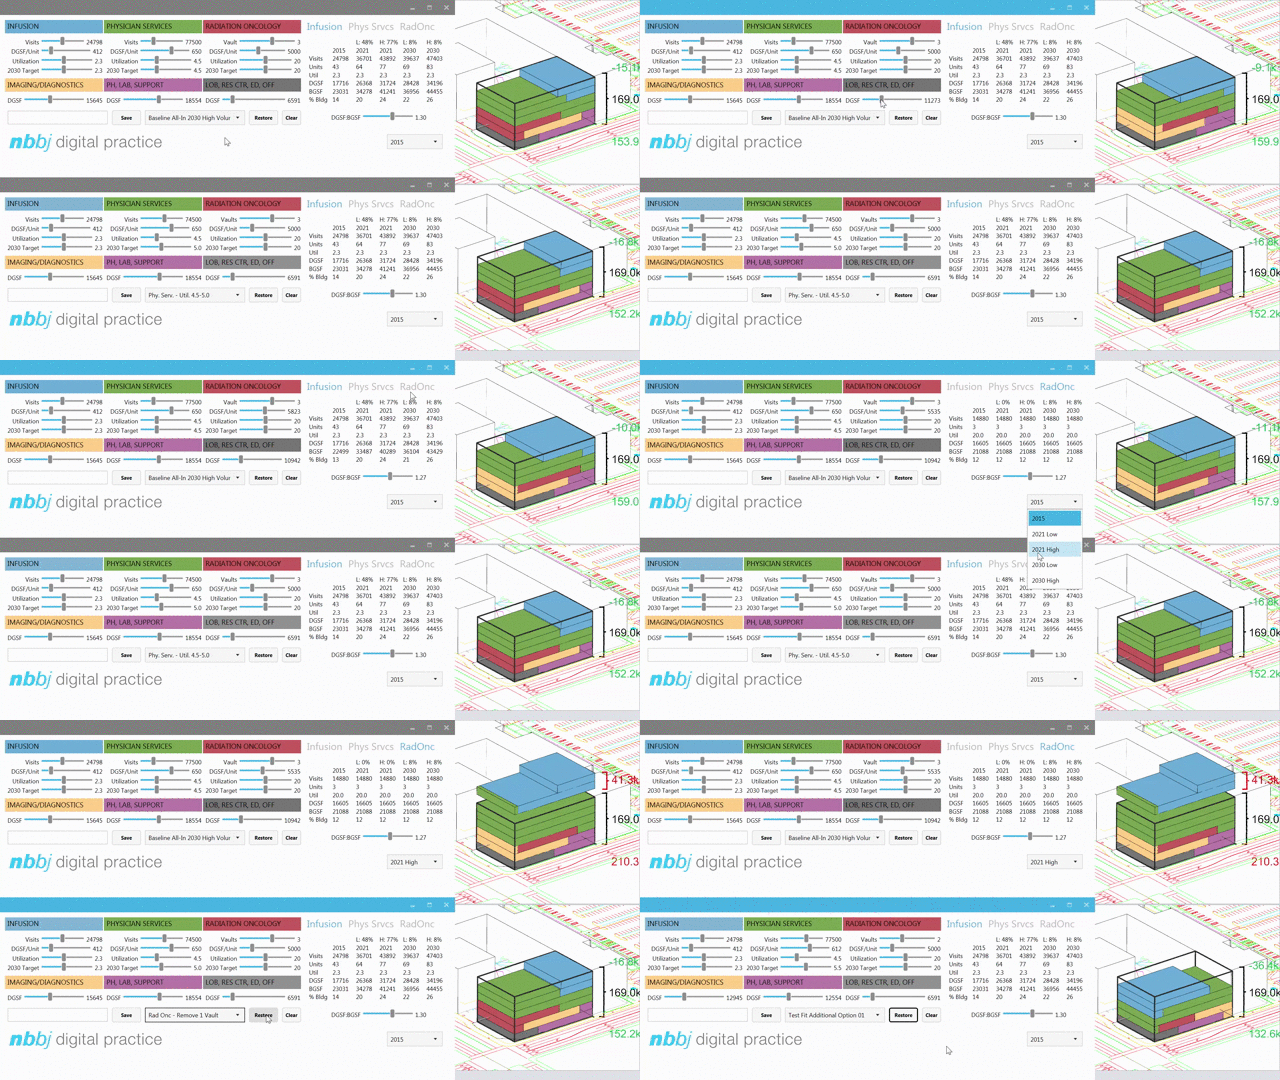
A custom-built, interactive visualization interface allows NBBJ to present diverse programming scenarios to hospital staff on the fly and to engage future users in the design process.
SSS: Designers have to have the confidence in their ability to influence the quality of life, which is what everyone is looking for now. If they spent more time doing this, we would see fewer claims about people-centered designs in buildings that often have little to do with people-centeredness. We need to combine visualization with intuition as well. So, how do these come together in client presentations?
ES: When you’re going to try to make a point, make sure you know your audience. Tailor your presentation toward asking specific questions. When you do this, you engage in discussion. When we listen to clients’ questions we can help them understand which are the most critical. But we don’t always have the opportunity to iterate with a client. Even so, it’s important to keep our foot in the door and make sure the conversation continues beyond the initial presentation.
MK: Presenters can either prove or disprove their knowledge of the topic and their true understanding of the matter at hand. We’ve all been in presentations where we concluded at the end that this person didn’t truly understand what the issue was. The more you can prove you understand exactly what boat you’re on, what direction it’s going, and what those issues are–that really enhances these tools. Without intuition and credibility, the tools are just numbers and visualizations.
SSS: How do you do find out who will receive the data you’re presenting?
MS: The process involves meeting as a design team. We know what issues are at the top of the client’s priority list. Then we have to understand the narrative we want to tell in order to address those issues directly. Knowing your client and where they stand before you enter the presentation puts you at an advantage. NBBJ works with a neurobiologist who’s doing some interesting research on presentation. He reminds us that humans have an attention span limit of about 10 minutes before we need some emotional stimulus to draw us back in. If you don’t present one of those every 10 minutes, the audience trails off. We also know that starting with the big picture and then getting into details is far more effective than the other way around. If you can demonstrate the value or the human story before digging into the details, you get a much better response and recall. We pay attention to those kinds of things as well when we’re crafting our presentations to clients.
ES: To some extent, I think that solid visualizations as communication tools enable the conversation to continue beyond the initial meeting. You’ll have a presentation that can be revisited without a face-to-face meeting. Then your ideas can sit or percolate in the mind of the people that you’re talking to.
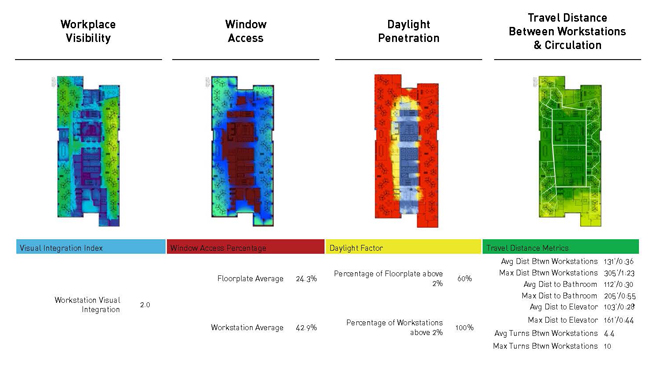
Graphic representations of factors like interior visibility, exterior views, daylight penetration, and travel distance help in the design decision making process and communications with stakeholders.
SSS: I’m really glad to hear that the intuition part is important to all of you because it feels like, with all the technology available to us, that we’ve lost it. When architects didn’t have the technology we have now, they were able to figure out how to cool and heat buildings in efficient ways, as well as where to put rooms to maximize sunlight. But we have ignored the natural world so much that we have to relearn all of that, which takes time.
MS: I get that there’s a bit of a dichotomy rising out of our conversation between technology on one hand and humanity on the other. But it’s really important to remember that the data are the people in a lot of ways. Technology and data are ways to understand who we are.
SSS: It is true. Technology and humanity are not separate. I’m not debating the validity of technology. But we do spend an awful lot of time with our technology, and this has lead to a yearning for well-made, crafted things suggest that we need to find ourselves away from our technology and not just within it. I think that designers and architects have such incredible, difficult, complex issues they’re dealing with today, issues that can’t be solved by one trade alone. They have to include every bit of human knowledge in order to understand the human beings that they design for. I’m really happy that we witnessed some of it right here in San Francisco.

Kaiser Oakland Medical Center, Oakland, CA. An outdoor garden with green plantings provides a place of respite for patients, providers and families.
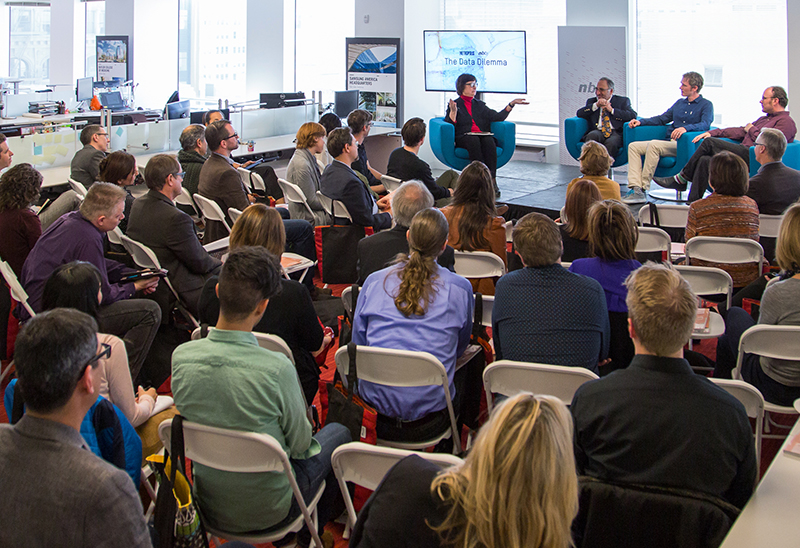
Susan S. Szenasy (on stage, left), concludes the panel by thanking the participants.
Panelists included:
NBBJ: Marc Syp, creative technologist and design computation leader; Michael Kaiser, M.D., former healthcare strategist director;
Stamen Design: Eric Socolofsky, design technologist;
Moderator: Metropolis, Susan S. Szenasy, publisher and editor in chief.
The Metropolis Think Tank series is presented in partnership with DuPont Surfaces, ASID, Sunbrella, Teknion, and USG.


